Category

Share-Market

17 stock metrics: value, growth, dividend strength, stability, momentum and sector analysis

By | Investing Times News, Share-Market | No Comments

IMG_3386 (640x481)If we agree the primary objective of stock-picking is to pick the winners and/or avoid the losers, then we must start with a framework that helps determine which companies to include.

For the vast majority of investors, this begins with a screening process to reduce the direct share universe down to a manageable number. The problem is that most screening processes involve no validation despite the fact there is an abundance of academic literature on the topic.

In the Investing Times attempts to offer logic, academic rigour and validity to this screening process. The idea is to assess the stock universe using the 3 F’s of Investing – Fear, Fundamentals and Forces – which leads us to 17 factors that each have academic support in contributing to out-performance. They generally aim to achieve dividend strength, growth, value, stability, momentum, sector bias and pricing acknowledgement.

17 factors sharemarketThis allows us to illustrate a number of “optimal” portfolios across differing styles – including balanced, stability-focused, dividend-strength, deep-value, growth-bias and sector rotation (we highlight optimal because it is subject to varies weaknesses we are transparent about).

The underpinnings that make the research different to others is that it focuses heavily on relativity to the sector median. This is vital and a key advantage to creating out-performance on a risk-adjusted basis. For example, a utility company (typically with a high depreciation expense) should not be compared to a bank as their earnings and cash-flow are accounted for very differently. Therefore, our logic implies that the Price to Earnings ratio should be isolated and compared by sector rather than by market.

Our data has allowed us to stress-test the outcomes of a stock universe over 6 years, involving more than 850 data validation periods. We acknowledge this isn’t nearly enough to have outright conviction, however we believe a combination of 6 years of stress testing along with a body of academic literature supporting the underlining metrics is a form of validation.

Creating a portfolio using the 17 metrics

As the founder of the Investing Times and Australian Investors Association, Austin Donnelly always said, “There is a difference between a good company and a good investment”. BHP may be a good company but it is not a good investment if you buy it at the peak of a mining boom. Therefore, the idea is to create a portfolio of investments with strong fundamentals and attractive pricing. The logic is that if any of the 17 indicators hinted to a buy signal, these are recorded and scored. If all seventeen indicators are suggesting underlying appeal, there is a reasonable likelihood of strong future performance.

If you wish to see the net result and top 20 holdings using this fundamental rigour, we encourage you to request the latest report as a free one-off trial. We will send this via email as a value-add with no obligations or cost.

Trial today

RECOMMENDED BY THE INVESTING TIMES

Long-term investment themes: 10 year + view of the trends, opportunities and challenges

| Economy, Investing Times News, Recommended by the Investing Times | No Comments
Drawing attention to the outlook and big themes present in the economy is always a healthy perspective. Below are a number of key themes to think about as you monitor your...

Facts about the Chinese economy: How likely is a financial crisis in China?

| Economy, Investing Times News, Most Viewed, Recommended by the Investing Times | No Comments
China is undoubtedly important to the global economy and with embedded signs of rising bad debts, there are enormous concerns surrounding China’s ongoing stability. Since 2005, China has accounted for...

It’s not (totally) the baby boomers fault: Why the working population matters most

| Headline Article, Recommended by the Investing Times, Uncategorized | No Comments

We have an unprecedented rise in the over 65 age group and our working population is growing at a more modest rate. This article will detail the real problems we face and how you can profit from it.

MOST VIEWED

Could Donald Trump send the USA bankrupt? And why the first challenge is February next year.

| Headline Article, Most Viewed, Politics | No Comments
Donald Trump and economic stability rarely go hand-in-hand. While Trump insists he’ll "make this country rich again", his path to riches has been subjected to four bankruptcy negotiations and his...

Recession risks: what are 10 of the top indicators to watch and why it works.

| Economy, Headline Article, Most Viewed | No Comments
What does it take to identify an impending recession? Obviously, this is an extremely complex question. However, there are at least 10 factors that have had a strong historical track-record...

“Would you rather be a miserable millionaire or happy and homeless?” How do you answer these questions?

| Lifestyle, Most Viewed | No Comments
The game of “would-you-rather” is a favourite past-time, usually involving an alcoholic beverage and a willingness to be embarrassed. However have you ever played a clean, moral-based version of the game that...

Can Warren Buffett and Robert Shiller both be wrong at the same time? Unlikely.

| Investing Times News, Most Viewed, Share-Market | No Comments
Warren Buffett and Robert Shiller should be familiar names to anyone with an active interest in the share-market. They are two of the most respected individuals on the planet when...

Evidence of 9 quantitative investment strategies that work. Do you track these metrics?

By | Investing Times News, Share-Market | No Comments

IMG_9048 (479x640)If an investor has the foresight to avoid investment bubbles, they have uncovered one of the most difficult elements to a successful long-term investment strategy. However, all too often, these bubbles are only identified with hindsight.

Emotions and market cycles – particularly those developed on fear and greed – mean that investment bubbles are likely to perpetually occur. In other words, it is euphoria which causes an investment bubble to form and fear that causes it to collapse. The Investing Times maintains thorough research on nine investment metrics that can potentially help identify the peaks and troughs in advance. Each have a tremendous track-record and should be added to every investors watch-list.

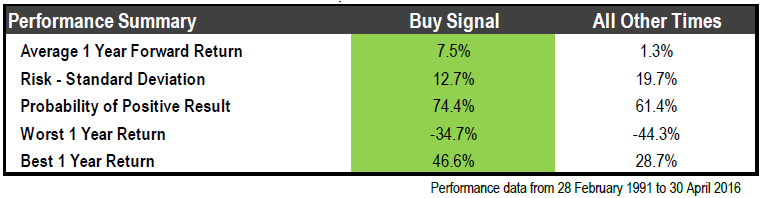
Below we identify these at a high level along with a performance extract from our Australian research database:

1. Shiller P/E Ratio – The Shiller P/E is a famous metric created by Robert Shiller who is a Professor at Yale University and Nobel Prize winner. His logic is that the traditional Price/Earnings gauge had two major flaws; firstly, that corporate earnings are too volatile, and secondly, that inflation needs to be considered to gauge long-term earnings. Hence he created a long-term gauge that assesses the past 10 years of real earnings (adjusted for inflation) and used this as a proxy for price. This creates a much more stable expectation of earnings upon which investors can make more reliable valuation estimates on price. As can be seen in the performance table, the Shiller metric has worked exceptionally well in Australia, which is backed by supportive global analysis.

Metric 1

2. Long-term Dividend Yield – The dividend yield can be considered one of the most under-rated components of an investment return. The dividend yield is calculated as the average dividend per share divided by the price. Therefore, a rising dividend yield implies that either a) companies are increasing dividends or b) that the price has fallen. The same applies in reverse. Given the negative correlation between dividend yields and the future price of the market, an opportunity exists to use dividends as a proxy for the long-term price of the market. While methods differ, our methodology takes the ‘regression average’ of the dividend yield over the past 15 years and compares this to the current dividend yield. Including a margin of safety, a buy indicator is apparent if the current dividend yield is 5% or more above the long-term average.

Metric 2

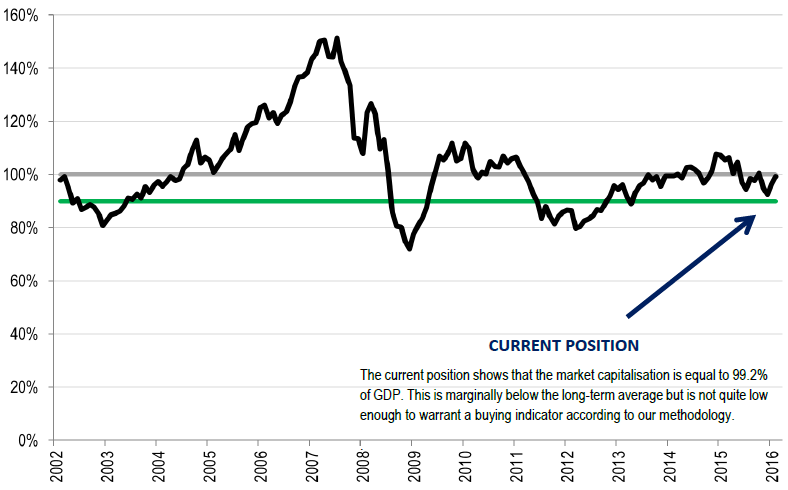
3. Market Capitalisation to GDP Ratio – Warren Buffett may be the world’s most famous investor and in recent decades he has unveiled his favourite metric to gauge the overall share-market. Buffett’s logic is that the size of all the listed companies in a given country should roughly track the overall size of the economy itself. The rationale is that business revenues are a subset of the economy and hence should match over the long-term. Therefore, the metric takes the market capitalisation of all companies and compares this to the GDP. Over the long-term, it has proven high-risk to invest when the market cap to GDP ratio exceeds 100% and low-risk to invest when it is low. We apply a margin of safety, so our methodology looks for times when the market cap is less than 90% of GDP for a buying signal.

Metric 3

4. The Zone System – Originally created by the founder of the Investing Times and the Australian Investors Association, Austin Donnelly, and then slightly modified thereafter, the Zone System is a long-term gauge of fair prices. The logic behind this system is that the market should average a very similar performance number over the very long-term, but this tends to fluctuate due to the economic cycle and sentiment surrounding fear and greed. Therefore, the Zone System allows an objective view by factoring in approximately two business cycles of historical analysis. Our application of the Zone System is to be willing long-term investors if the market is equal to or below its long-term average (i.e. Zones 3, 4 or 5). In reality, the further below the long-term moving average (i.e. Zone 5), the better the prospects for forward returns.

Metric 4

5. The Dividend Yield vs Bond Yield – The Yield Gap applies logic that investors are always making a decision between stocks and bonds (or growth assets and defensive assets). Therefore, it is common-sense to analyse the pricing of these together. There are various versions on the most appropriate application of this logic, but our methodology uses the market dividend yield compared to the Treasury bond yield over the long-term. By comparing the grossed up dividend yield of the overall market to the 10-year bond yield, we can clearly see which way investors might move their funds. For example, if bond yields are very high relative to stocks, a rational investor will move his/her money from stocks to bonds and vice versa. Our methodology uses the long-term moving average of these numbers and the grossed up dividend yield of at least 20% higher is desirable.

Metric 5

6. The 45-64 year old Demographic – The mature age working population is defined as the civilian population between the ages of 45 to 64. This is deemed to be the most important segment of the population for share-holders as these individuals are the most likely to be net buyers of shares. The logic behind this is that 45-64yo individuals are generally gearing up towards retirement and a combination of greater incomes with lower family commitments in general. The importance of tracking demographic trends is imperative as various reputable studies have shown a declining working population creates high risks of deflation and a 40% reduction in future GDP.

Metric 6

7. The Shape of the Yield Curve – A “recession factor” draws on a body of evidence, demonstrating the power of the yield curve in predetermining recessionary conditions. More specifically, an inverse yield curve is said to be one of the most reliable predictor of recessions among all financial data. Our application of tracking the yield curve is a simple calculation taking the 10-year government bond yield minus the 5-year government bond yield. The idea is to simply avoid the share-market during times when it is negative. It should be noted that a positive yield curve is considered normal as it factors in inflationary expectations and liquidity risks.

Metric 7

8. The Coppock Indicator – The Coppock Indicator is famous among technical traders but is arguably under-utilised by long-term value investors. E.S.C Coppock was a well-known economist in the 1960’s that utilised knowledge of behavioural patterns, especially around bereavement. Specifically, he found that the average human mourns for a period of approximately 11 to 14 months on average before finding stability. Coppock’s logic was that investors experience a similar sense of bereavement when markets fall which requires a period of mourning. He therefore rationalised that an investor would not re-enter the market until this period of mourning has finished. From this behavioural pattern, Coppock created a technical system that identifies recovery patterns in share-markets. While the story is unique, the evidence is compelling and the reason why it is contained on this list.

Metric 8

9. The Average Allocation to Equities – The optimism/pessimism allocation metric is a gauge of household behaviour towards the share-market. It specifically tracks the percentage of household wealth being directed towards personal equities, which has had a history of rising and falling depending on sentiment around fear and greed. If the average household is investing less than average in the share-market, this is considered a sign of excessive pessimism and can be expected increase over time. The same applies in reverse, as a high percentage shows over optimism and can be expected to fall. The inflows/outflows this creates over the long-term has had a significant impact on performance.

Metric 9

Final Thoughts

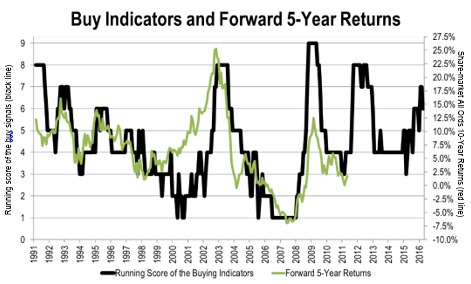
We can see above that each of these metrics have the ability to idenitify mis-pricing opportunities. There are multiple limitations to each metric, and these need to be understood if you wish to use them as part of your investment philosophy. However, there is a real power of tracking metrics such as the above, especially as a combination, which can be best explained below. We urge readers to add these nine metrics to their watch-lists.

Science of Investing Performance 5 Years

Note: If you wish to see the net result and current standings of these metrics using fundamental rigour, we encourage you to request the latest report as a free one-off trial or by subscribing to our ongoing report.

Trial today

RECOMMENDED BY THE INVESTING TIMES

Long-term investment themes: 10 year + view of the trends, opportunities and challenges

| Economy, Investing Times News, Recommended by the Investing Times | No Comments
Drawing attention to the outlook and big themes present in the economy is always a healthy perspective. Below are a number of key themes to think about as you monitor your...

Facts about the Chinese economy: How likely is a financial crisis in China?

| Economy, Investing Times News, Most Viewed, Recommended by the Investing Times | No Comments
China is undoubtedly important to the global economy and with embedded signs of rising bad debts, there are enormous concerns surrounding China’s ongoing stability. Since 2005, China has accounted for...

It’s not (totally) the baby boomers fault: Why the working population matters most

| Headline Article, Recommended by the Investing Times, Uncategorized | No Comments

We have an unprecedented rise in the over 65 age group and our working population is growing at a more modest rate. This article will detail the real problems we face and how you can profit from it.

MOST VIEWED

Could Donald Trump send the USA bankrupt? And why the first challenge is February next year.

| Headline Article, Most Viewed, Politics | No Comments
Donald Trump and economic stability rarely go hand-in-hand. While Trump insists he’ll "make this country rich again", his path to riches has been subjected to four bankruptcy negotiations and his...

Recession risks: what are 10 of the top indicators to watch and why it works.

| Economy, Headline Article, Most Viewed | No Comments
What does it take to identify an impending recession? Obviously, this is an extremely complex question. However, there are at least 10 factors that have had a strong historical track-record...

“Would you rather be a miserable millionaire or happy and homeless?” How do you answer these questions?

| Lifestyle, Most Viewed | No Comments
The game of “would-you-rather” is a favourite past-time, usually involving an alcoholic beverage and a willingness to be embarrassed. However have you ever played a clean, moral-based version of the game that...

Can Warren Buffett and Robert Shiller both be wrong at the same time? Unlikely.

| Investing Times News, Most Viewed, Share-Market | No Comments
Warren Buffett and Robert Shiller should be familiar names to anyone with an active interest in the share-market. They are two of the most respected individuals on the planet when...

Stock-picking skills: a key metric from Bruce Berkowitz, one of the world’s best investors

By | Investing Times News, Share-Market | No Comments
In search of perfection: Copy thy best

In search of perfection: Copy thy best

The world’s best investor is a distinguished title – no doubt about it. And a lot of names are regularly thrown around – Warren Buffett, George Soros, Bruce Berkowitz, David Tepper, John Paulson, Peter Lynch, to name a few.

We introduce to you the ‘Investor of the Year of 2013’ according to gurufocus.com and seek to identify what makes his investing technique so special. More importantly, we are looking for lessons and trading ideas.

Introducing Bruce Berkowitz

Without boring you with his life story, Bruce Berkowitz was Morningstar’s ‘Investor of the Decade’ through the tech wreck of 2001 and the GFC in 2007-09. What is most impressive is that the Fairholme Fund, which Berkowitz manages, has returned a cumulative +306.49% since it commenced in 1999 versus a total benchmark return of just +24.39%.

In fact, he has outperformed the index in 94 out of 97 rolling 5 year periods (and investors should know how hard it is to outperform the index at all).

Getting down to what matters…

To be practical for us, we want to know what makes him a great investor. Most people would agree that an impeccable track-record over the long-term is the evidence that separates a good investor from a great one. But the track-record is an outcome, not a formula.

A great investor must have an investing philosophy which enables them to either a) pick the winners or b) avoid the losers.

Sounds pretty simple, but any investor worth their salt understands how hard this can be.

Lessons for Australians

Thankfully, Berkowitz speaks publically about his investing style which creates a fantastic opportunity for us to learn valuable lessons. Below is a summary of the key principles that have allowed Berkowitz to outperform exceptionally:

  • Find the intrinsic value of a business. “People like to predict rather than price”.
  • Take a 5 year view. “We go back five years to measure 5-year performance”.
  • Don’t try to perfectly time your entry into assets. “I have proven time and time again that I can’t time the bottom of the market, but when I see $1.00 selling for $0.50, I buy and my feeling is if I’m early and the price goes down further, I have the chance to buy more. With being early, you look wrong until you’re right”.
  • Only diversify if you don’t know what you’re doing. “Why would I own my tenth best idea when I can own more of my best idea?”
  • Find businesses that are selling at a discount. “I want to buy stocks that other people hate”.
  • Use history as your guide. “History doesn’t exactly repeat itself, but it does rhyme”.
  • Nobody is perfect. “Oh, there are always hundreds of mistakes”.


Berkowitz’s key advantage?

It appears that Berkowitz does his best work while analysing the balance sheet of a business. In this sense, he is very similar to Warren Buffett. But while the average investor will find it very difficult to replicate his methodology, Berkowitz loves to refer to the “Price to Book Value ratio”.

In simple terms the price to book value ratio is a comparison of what the market implies a company is worth (ie. the share price) versus what the accountant thinks it is worth. It also has one of the best records in history.

A quick Google search will reveal numerous PhD’s which confirm that a low P/BV results in significant outperformance over the longterm, whereas a high P/BV has the opposite effect. This has become one of Berkowitz’s keys.

Berkowitz loves to find a business that is worth more dead than alive, meaning that if the doors were shut they would get more money than what the current shareholding is worth.

Should we rely on P/BV?

Using common sense, it is unsustainable for the P/BV to perpetually expand or shrink, except in the event of a business failure. Therefore, it is natural to see that this ratio should normalise in the long-run, creating opportunities in companies with an abnormally low P/BV. You will note that the lowest P/BV opportunities are often unloved stocks, at least temporarily, however this is the perfect hunting ground.

Beware that this ratio doesn’t work all the time (if it did, everyone would follow and it wouldn’t work) but don’t be mistaken because it has proven to work in the long-run and across multiple countries.

How you can copy Berkowitz?

Screening your portfolio for P/BV is the recommended starting point. The odds are it will show one or more of your investments have unattractive fundamentals. The other key lessons are to be relentless in finding bargain prices, don’t follow the crowd, have conviction and be willing to accept that prices may move the wrong way in the short-term.

Note: The Investing Times uses the Price to Book Value ratio as one of its 17 stock-market valuation tools in the “Direct Share Research Weighting Models”. If you wish to see the other 16 metrics and its performance history, request a one-off free trial edition or subscribe here.

RECOMMENDED BY THE INVESTING TIMES

Long-term investment themes: 10 year + view of the trends, opportunities and challenges

| Economy, Investing Times News, Recommended by the Investing Times | No Comments
Drawing attention to the outlook and big themes present in the economy is always a healthy perspective. Below are a number of key themes to think about as you monitor your...

Facts about the Chinese economy: How likely is a financial crisis in China?

| Economy, Investing Times News, Most Viewed, Recommended by the Investing Times | No Comments
China is undoubtedly important to the global economy and with embedded signs of rising bad debts, there are enormous concerns surrounding China’s ongoing stability. Since 2005, China has accounted for...

It’s not (totally) the baby boomers fault: Why the working population matters most

| Headline Article, Recommended by the Investing Times, Uncategorized | No Comments

We have an unprecedented rise in the over 65 age group and our working population is growing at a more modest rate. This article will detail the real problems we face and how you can profit from it.

MOST VIEWED

Could Donald Trump send the USA bankrupt? And why the first challenge is February next year.

| Headline Article, Most Viewed, Politics | No Comments
Donald Trump and economic stability rarely go hand-in-hand. While Trump insists he’ll "make this country rich again", his path to riches has been subjected to four bankruptcy negotiations and his...

Recession risks: what are 10 of the top indicators to watch and why it works.

| Economy, Headline Article, Most Viewed | No Comments
What does it take to identify an impending recession? Obviously, this is an extremely complex question. However, there are at least 10 factors that have had a strong historical track-record...

“Would you rather be a miserable millionaire or happy and homeless?” How do you answer these questions?

| Lifestyle, Most Viewed | No Comments
The game of “would-you-rather” is a favourite past-time, usually involving an alcoholic beverage and a willingness to be embarrassed. However have you ever played a clean, moral-based version of the game that...

Can Warren Buffett and Robert Shiller both be wrong at the same time? Unlikely.

| Investing Times News, Most Viewed, Share-Market | No Comments
Warren Buffett and Robert Shiller should be familiar names to anyone with an active interest in the share-market. They are two of the most respected individuals on the planet when...

Can Warren Buffett and Robert Shiller both be wrong at the same time? Unlikely.

By | Investing Times News, Most Viewed, Share-Market | No Comments

IMG_9055 (480x640)Warren Buffett and Robert Shiller should be familiar names to anyone with an active interest in the share-market. They are two of the most respected individuals on the planet when it comes to money matters, and each have varied yet complimentary views on what drives the overall share-market.

Therefore, the title of this article has an underlying power behind it. “Can Warren Buffett and Robert Shiller both be wrong at the same time” is really the same way of saying “These two people are legends of their field and worth watching closely”.

The reason these two men are exceptional

Robert Shiller’s CV includes being the Professor of Economics at Yale University and a Nobel Prize winner in Economics. More importantly, he is the man behind the Shiller P/E ratio – a complex and compelling share-market indicator.

The Shiller P/E ratio is known as the more stable and reliable cousin of the Price to Earnings ratio, and is a market valuation tool that has accurately predicted the bubbles of recent decades (including famously for the 1987 Crash and the GFC in 2007/08).

Shiller PE Ratio in Australia

Shiller PE

Warren Buffett is the world’s 3rd richest man and better known for his ability to source businesses that have an understandable business model and long-term abilities to grow. He is quick to tell people he cannot predict the short-term direction of the market, however, underlying his strategy is an optimistic outlook for the overall economy and a strong consideration on its relationship with the share-market. In fact, it is the relationship between the share-market and the economy that has made him a fortune along with his “buy low, sell never” company philosophy. More specifically, Buffett has been documented on multiple occasions for his consideration of the Market Capitalisation of the overall share-market and its position relative to the nominal value of the overall economy. This is called the Market Cap to GNP ratio or the Market Cap to GDP ratio.

Market Cap to GDP Ratio in Australia

Buffett Market Cap to GDP

Utilising the favourite metrics of the smartest minds in a field would be seen by many to be a no-brainer. Going against it could be like ignoring the opinion of the world’s best heart surgeon when needing a heart transplant.

Yet fund flows continue to diminish and the average allocation to equities continues to remain well below historical norms in Australia. This is despite the Shiller PE being below historical norms and the Market Cap to GDP around historical norms.

Summary

It will take time before we know who will make the correct long-term judgement – the Shiller/Buffett duo or the average Australian – but it would seem unlikely to be the latter.

Note: This articles comes from the most popular and commented data from the Investing Times Asset Allocation Research document. This comprises nine of the most influential factors that determine share-market value (including the Shiller PE and Buffett Market Cap to GDP ratio), with a compelling track-record over a 25-year period in Australia.

If you wish to see the 9 metrics, please request a free trial below and we will forward it by email. This is a value-add with no obligation.

Trial today

RECOMMENDED BY THE INVESTING TIMES

Long-term investment themes: 10 year + view of the trends, opportunities and challenges

| Economy, Investing Times News, Recommended by the Investing Times | No Comments
Drawing attention to the outlook and big themes present in the economy is always a healthy perspective. Below are a number of key themes to think about as you monitor your...

Facts about the Chinese economy: How likely is a financial crisis in China?

| Economy, Investing Times News, Most Viewed, Recommended by the Investing Times | No Comments
China is undoubtedly important to the global economy and with embedded signs of rising bad debts, there are enormous concerns surrounding China’s ongoing stability. Since 2005, China has accounted for...

It’s not (totally) the baby boomers fault: Why the working population matters most

| Headline Article, Recommended by the Investing Times, Uncategorized | No Comments

We have an unprecedented rise in the over 65 age group and our working population is growing at a more modest rate. This article will detail the real problems we face and how you can profit from it.

MOST VIEWED

Could Donald Trump send the USA bankrupt? And why the first challenge is February next year.

| Headline Article, Most Viewed, Politics | No Comments
Donald Trump and economic stability rarely go hand-in-hand. While Trump insists he’ll "make this country rich again", his path to riches has been subjected to four bankruptcy negotiations and his...

Recession risks: what are 10 of the top indicators to watch and why it works.

| Economy, Headline Article, Most Viewed | No Comments
What does it take to identify an impending recession? Obviously, this is an extremely complex question. However, there are at least 10 factors that have had a strong historical track-record...

“Would you rather be a miserable millionaire or happy and homeless?” How do you answer these questions?

| Lifestyle, Most Viewed | No Comments
The game of “would-you-rather” is a favourite past-time, usually involving an alcoholic beverage and a willingness to be embarrassed. However have you ever played a clean, moral-based version of the game that...

Can Warren Buffett and Robert Shiller both be wrong at the same time? Unlikely.

| Investing Times News, Most Viewed, Share-Market | No Comments
Warren Buffett and Robert Shiller should be familiar names to anyone with an active interest in the share-market. They are two of the most respected individuals on the planet when...